 “What is chemical spectra?”, I hear you ask. Without getting too “technical”, I often explain chemical spectra as the “fingerprint” that chemicals “emit” when they are excited by an energy source. There are a number of different ways of generating a “fingerprint” from a chemical compound – either by illuminating it with some form of light (primarily infrared or IR), placing it within an electromagnetic field (nuclear magnetic resonance or NMR) or determining the molecular weight of the components of the material and determining the ratio of the components to determine the makeup of the compound (mass spectroscopy or MS). As you measure the compounds reaction to the stimulus across the frequencies (or wavenumbers), you see a response that is measurable and quantifiable. A great tutorial in some respects can be found at the Purdue Library site.
A more familiar analogy to this concept is the frequency response of a stereo speaker. When you speak to a stereophile, you will learn about how the speakers you choose can modify the "highs" and "lows". As sound energy is generated within the speaker, the physical characteristics
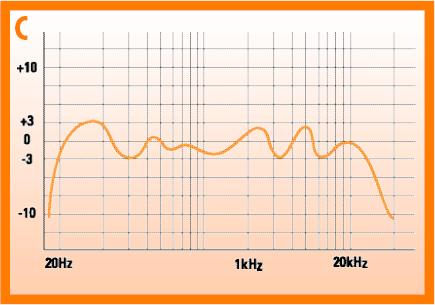 of the speaker (e.g. speaker cone, the speaker housing, the magnetic coil) all contribute to the dynamic response of the speaker. If there is a vibrational mode (a point in the frequency range that causes the speaker to respond) within the range of hearing, then the dynamic response will be effected. The classic opera singer causing a crystal glass to shatter is a classic example of a vibrational mode going arwy.
Spectroscopy uses the same concept, but with different energy sources, and it measures the vibrational intensities of the chemical bonds that exist within a compound. Carbon-oxygen bounds vibrate at one frequency, Carbon-hydrogen bonds vibrate at another. Consider when compounds made up of a number of different springs, dampers and masses all have a different response to excitation. Now, consider that the compound is a three-dimensional object being measured in a two-dimensional fashion. This leads to a lot of interpretation.
Years ago, spectroscopy was considered an art – where IR spectra were collected bound into books and journals and researchers would pour over the images to see if there were similarities between their experimental data and the reference data collected in the journals. As we moved toward improved systems and accuracy (NMR is highly accurate and discriminatory), the electronics used in spectroscopy offer tools for prediction and identification of spectra based on the libraries contained within the spectrometer’s reach. But, the challenge has been, do you have enough spectra to be able to have an understanding of all potential spectra available?
A vision of a SPECTRAL Universe
While my background in electrical engineering and robotics, when I was a kid, I used to love playing with my chemistry set. I did not know about the concept of spectroscopy, and if I had when doing my PhD work, I might have laughed at how similar it truly is. I used to spend hours causing my robotic arm to vibrate at different frequencies so I could see the output response of the system and create its dynamic response. Being non-linear (linearity properties did not apply for all conditions) and time-variant (if the gears were warmed up after use versus just starting), the system had a reasonable linear response – which I would then characterize and attempt to identify. In spectroscopy, the same concept is used, but being a chemical compound, one is not always certain of the same conditions. The measurement of a compound’s spectra can have a number of sources of variance including:
- Concentration levels versus contaminants
- Instrumentation differences (e.g. resolution error)
- Operator error (student versus a skilled technician)
- Temperature
- Humidity
- ...and on and on...
Instead of the search for perfection, my belief is that accuracy can be found by the concept of clustering that all of the search engines and datamining companies use on a regular basis.
To bring “clustering” into perspective, think of the universe of spectra being infinitely vast and empty. For our simple discussion here, let us chose a chemical – say, ethanol – which, after being measured by the perfect spectrometer, has a spectra with three values (xe, ye, ze). Also assume that all spectra have a three dimensional point assigned to them (x, y, z). Now, ask a group of scientists (let’s say 50) to measure the spectra of ethanol (same composition, same concentration, everything). When all 50 points were gathered and plotted in the universe, you would see 50 points, primarily clustered around (xe, ye, ze) – which would create a likelihood of any other spectra that falls within that cluster to be ethanol.
This is the basis for my concept of the Spectral Universe.

Now consider that spectra can have over 2000 points or more to represent themselves. This “universe” could conceivably have over 2000 points to help identify in “space” which spectra is what. And, with samples from a large group of people, clusters of spectra would help identify chemical compounds – even ones that are corrupted by any number of variance factors. All by surfing the “spectral universe” to determine the most likely candidate. This was the inspiration of the SPECIAL Project.
The SPECIAL/Red Hen Project
Originally started as a Windows client to search your personal spectral library by Professor John Bove at Cooper Union, the SPECIAL Project evolved into a demonstration of collaboration and open data between chemical spectroscopists and scientists using technology to improve the identification of chemical compounds. Instead of relying on an absolute reference as has been managed by vendors and other providers maintaining a lock on innovation by controlling their intellectual property, the SPECIAL Project is meant as an opening – a marketplace to allow chemists and academics to work together to create a common spectral database and to build upon the platform to improve the capabilities within it.
Instead of relying solely on the innovation cycle of hardware vendors, chemists can develop new ways of evaluating chemical spectra and other chemical data to allow for richer discoveries through the aggregation of many sources of data into a single framework. Similar to what was discussed as .NET and "mashup" APIs, the SPECiAL Framework will allow disparate data sources to work in concert with other applications, once the interface and rules have been designed and developed to enable the protections and interfaces needed for the data source owner.
By respecting the intellectual property rights of the creator of the spectra (just like being the rights owner of any form of digital media like music or movies), the SPECIAL Project is designed to give a framework for database owners a chance to monetize their spectral data in a fashion that allows for per-use offering while also supporting the free exchange of spectral data amoungst members of the community. With an additional focus on interoperability with other software platforms and hardware systems (e.g. spectrometers have their own data storage format), the goal is to create a system that allows for mashups of hardware and software to create more compelling applications using spectroscopy.
 When NASA sends off the Mars Scientific Laboratory in 2009, onboard will be a spectrometer the size of today’s Palm treo. Think about the possibilities if you could have your own personal spectrometer for your own evaluation of caloric content. Or for determination of breast cancer without invasive surgery (mammagrams in the privacy of your own home). Or spectral detectors of bomb materials as you walk through the airport security system more reliable than what is offered today.
Am I painting a future of the Star Trek tricorder? I sincerely hope so. But to get there, we have some technology research to do. We are very close. William Shatner - want to do another special on the effects of Star Trek?
1 comment:
Clustering is one idea. But it could be equally valid to just run a multinominal logistic regression, neural network, or decision tree on spectral data. The result would be a probability, based on characteristics, that each spectra represents each chemical compound. The one with the highest probability is the best choice. Anyway, even if you define clusters, you would likely use this approach to assign new spectra to the most likely cluster.
The key to allowing most data mining methods to work is to get the data into a single denormalized table, one row per spectra. You need to be able to use all of the data at once to mine it (or at least a large random sample).
But what about the digital rights management (DRM) issue? One way to manage this is to provide the data mining framework, and be the trusted third party managing the pay-per-use (or other) usage model.
Post a Comment